Specifying Fracture Toughness and Reference Temperature for Successful Stamping Operations
Specifying Fracture Toughness and Reference Temperature for Successful Stamping Operations
The goals of this project were: (a) to measure the tensile and fracture toughness properties of two high-strength thin steel sheets and (b) to determine the reference temperature (T0) of each steel sheet using in-situ Automated Ball Indentation® (ABI®) tests conducted at room temperature. For comparison, miniature tensile specimens were machined from each sheet in the longitudinal and transverse orientations (L and 90°). All mechanical tests were conducted at room temperature (22°C).
The room-temperature ABI tests produced true-stress versus true-plastic-strain curves that are in good agreement with those from the miniature tensile specimens. The yield and ultimate strength values from the ABI® tests were within ±2% of those from the tensile specimens. Comparison of the test results from all miniature tensile specimens and from the ABI® tests conducted on the end tabs of the miniature tensile specimens are given in Figure 1.
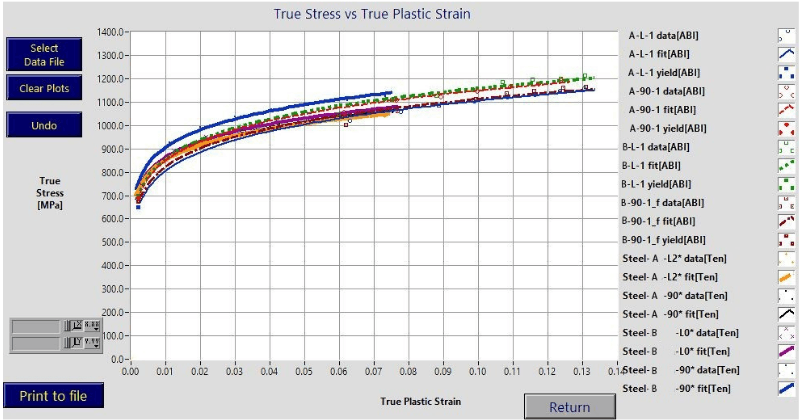
Figure 1 Overlay graphs of true-stress/true-plastic-strain curves from 4 miniature tensile specimens and from 4 ABI® tests conducted on one end tab of each miniature tensile specimen.New Paragraph
The ABI® test results are provided in Table 1. The fracture toughness Master Curves (MCs) from duplicate ABI® tests on the two “A” and “B” steel sheets are shown in Figure 2 (although there were only two ABI® tests instead of six each, the ABI®-determined fracture toughness values are valid and used here for MC comparison between the two steel sheets).
The ABI®-determined T0 values for the two steels (A and B) were -16°C and -14°C, respectively. Per ASTM Standard E1921, and since the T0 values were within 20°C for the two steels, they are considered of the same material and the average T0 for both steels is -15°C. This T0 value of -15°C shows that stamping at room temperature falls in the transition region (ductile-to-brittle transition as shown in Fig. 2) with large variations in fracture toughness values (approximately from 100 MPa√m on the 5% probability limit curve to 240 MPa√m on the 95% limit curve). This explains why cracking occurred at different places during the stamping of these sheets; although the two steels meet the specified tensile strength values and ductility properties. Hence, this proves that tensile properties requirements alone are not sufficient and a Reference Temperature (T0) range should also be specified for steel acquisition. However, because the steel sheets are thin, destructive fracture toughness specimens cannot be machined or tested. In contrast, the ABI® tests produce valid fracture toughness results and valid Reference Temperature even for 1-mm thick sheets using a 0.76-mm diameter ball indenter (because the final indentation depth of 0.09-mm is less than 10% of the thickness of the thin steel sheet).
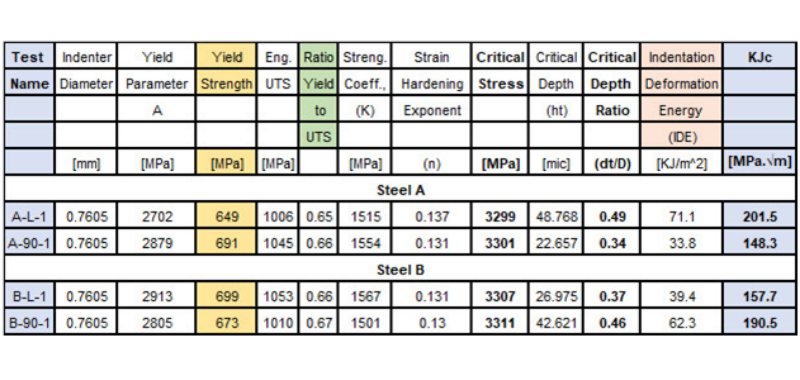
Table 1 Summary of ABI® tests conducted on the four miniature tensile specimens of steel sheets A and B.
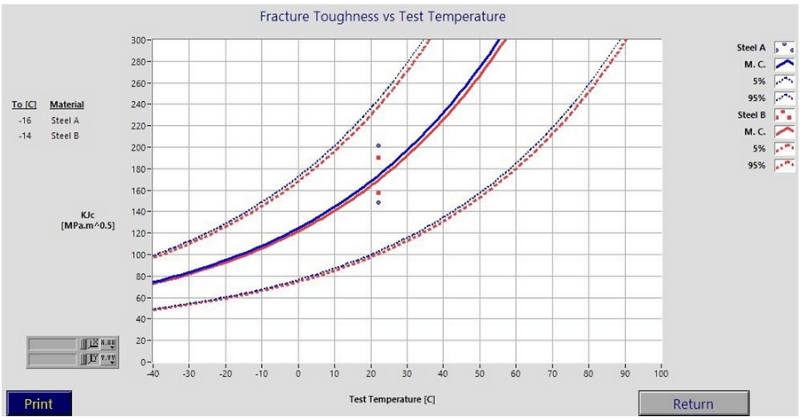
Figure 2 Fracture Toughness Master Curves from ABI® tests on Steel Sheets A and B. The Reference Temperature (T0) is the test temperature at a median fracture toughness level of 100 MPa√m. The solid curves are the median curves (50% probability limit curve) while the dashed curves are the 95% and 5% probability limit curves.
Median Fracture Toughness Master Curve Equation per ASTM Standard E1921:
KJc = 30 + 70 x e 0.019 (T-T0) [Equation 1]
Where KJc is the median fracture toughness in MPa√m, T is the test temperature in Centigrade, and T0 is the reference temperature at a median fracture toughness level of 100 MPa√m.
Using Equation (1) above, the median fracture toughness for a T0 of -15°C would be 171.4 MPa√m while a T0 of -40°C would produce a median fracture toughness value of 257.4 MPa√m (i.e., a 50% increase above that value for T0 of -15°C). A lower Reference Temperature increases the median (50% probability) and the 5% probability values of fracture toughness at the stamping operation temperature and reduces the formation of cracks at high stress intensity value sites (severe deformation locations) during the stamping operation. This will obviously improve the stamping production efficiency and reduces the number of reject-steel coils.
Solution
To prevent crack formation during the stamping of thin sheets, the highest stress intensity factor (at the severest bend of the stamping die) must be lower than the initiation fracture toughness of the steel sheet. This can be calculated using finite element analysis or other methods for each stamping industry. For high strength steel sheets, although the probability of crack formation is small, the two concerns of potential low fracture toughness and/or relatively high reference temperature must be addressed. Figure 3 is an example of a good steel where the median fracture toughness is 210 MPa√m and the 5% low probability limit at 20°C is 120 MPa√m. A manufacturer ordering sheet steel could, in addition to the tensile properties requirement, also add a minimum fracture toughness of 120 MPa√m and a Reference Temperature (T0) of less than -27°C. Such requirements are stamping industry specific as well as component specific.
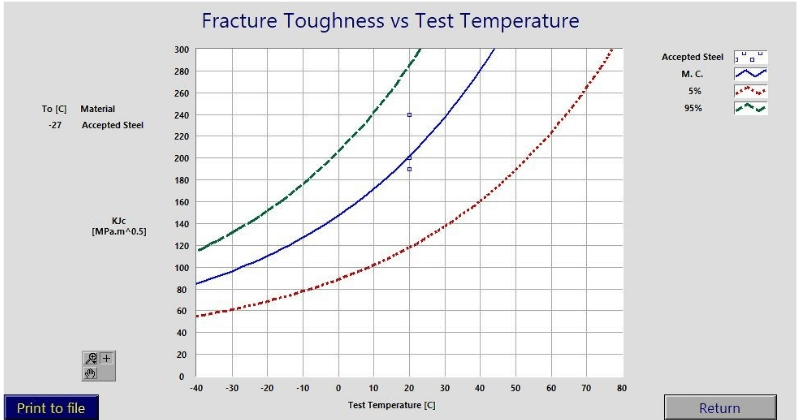
Figure 3 An example of the fracture toughness Master Curve of accepted steel sheet for stamping an automotive body.
Discussion
Because of the thin nature of the steel sheets (approximately 1-mm), it is impossible to machine valid specimens, and there are no results from destructive fracture toughness testing. However, the ABI®-determined fracture toughness values and the Reference Temperatures have been verified by numerous studies comparing both ABI® and valid destructive tests conducted on ferritic steels as published in papers) and in the Haggag Tensile and Toughness Method (HTTM). A comparison of the Reference Temperature (T0) from both ABI® and from valid destructive fracture toughness specimens, over a wide range of temperatures, is shown in Figure 4.
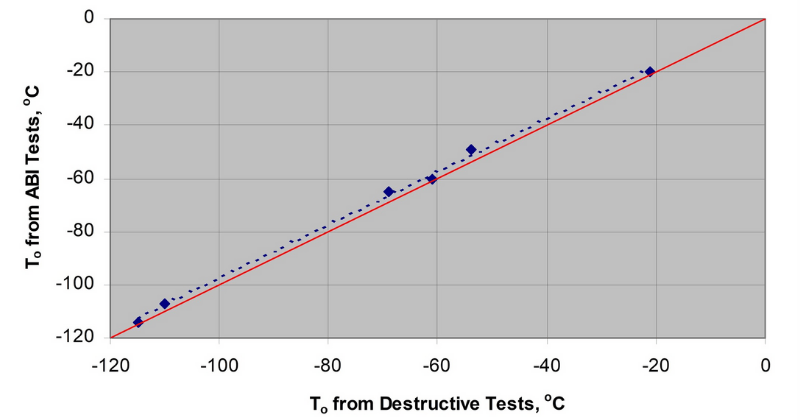
Figure 4 Comparison between the reference temperature from Haggag’s HTTM tests and from destructive fracture toughness tests on six ferritic steel materials. The reference temperature values from HTTM tests are consistently conservative by less than 5°C (Ref.: Haggag, F. M., “Nondestructive and Localized Measurements of Stress-Strain Curves and Fracture Toughness of Ferritic Steels at Various Temperatures Using Innovative Stress-Strain Microprobe® Technology,” SBIR Final Report U.S. Dept. of Energy Award DE-FG02-96ER82115, Oct. 1999, Page 30).
The HTTM standard is available from:
Standard Test Methods for: “Nondestructive and Localized Determination of Stress-Strain Curve and Initiation Fracture Toughness of Ferritic Steel Samples and Structures Using Haggag Tensile and Toughness Method (HTTM)” November 2015 and other publications are also available here.
Conclusion
It was demonstrated in this paper that specifying only tensile properties (yield strength, ultimate strength, and ductility) of steel sheets used in stamping manufacturing in various industries is not sufficient to prevent the potential formation of some cracks during the stamping operation at ambient temperature. Also, it was concluded that a specified range of the fracture toughness Reference Temperature (T0) should be required for requisition of steel coils for efficient production and reducing the amount of rejected steel coils.
Because machining valid fracture toughness specimens (with enough thickness of 12-mm or more) from thin sheets is impossible, the in-situ ABI® testing is the only available option for specifying fracture toughness and reference temperature for successful stamping operations.
ABOUT THE AUTHOR:
Fahmy Haggag has more than 45 years of experience in the materials engineering field with emphasis on research and development in the areas of fracture mechanics, metallurgy, applied mechanics, miniaturized specimen technology, structural integrity, pipeline infrastructure, and nuclear engineering including radiation damage and reactor safety. His extensive experimental and analytical work resulted in more than 80 publications in the scientific literature. Fahmy is the
inventor of U.S. Patent 4,852,397 ("Field Indentation Microprobe for Structural Integrity Evaluation", 1989) and has held research and development positions at the Oak Ridge National Laboratory (Idaho), National Engineering and Environmental Laboratory, Battelle Columbus Laboratories, University of California at Santa Barbara, Algerian Nuclear Research Center and University of Algiers, and the Egyptian Atomic Energy Authority.


